One useful outcome: Upload a survey, read its Brief, ask one follow-up, and share a checked two-sentence takeaway with the saved Brief.
Your task: “Which option did respondents choose most often, and how do their ratings compare?” Follow these steps in DataWhisperer; no formulas or paid Tables/Stats detour is needed.
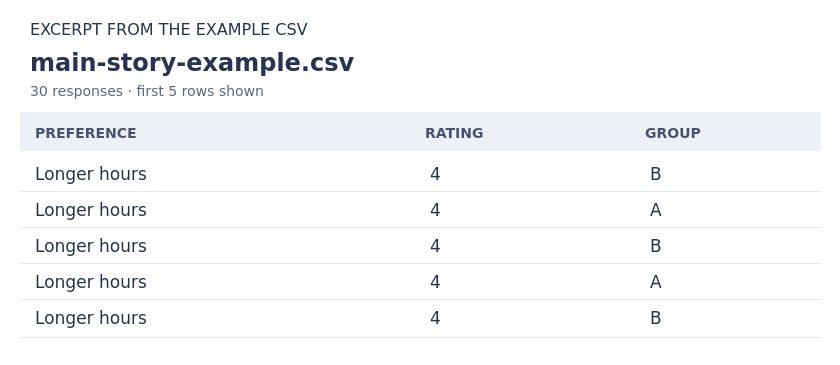
Download the example survey CSV. This example dataset, not customer research, has 30 responses: preference (Longer hours, More locations, or blank), rating (numeric), and group (A or B). A and B are labels, not named places or customer segments.
The rows were made up for teaching; treat the findings as practice, not a business recommendation.
 Data loaded in ~1 sec
Representative 48-row sample estimate, not a timed action in this preview. File size and task vary; loading and display affect total elapsed time; not a browser completion guarantee. Representative import estimate; this input illustration is not a timed action.
1. Sign in and upload the example
Create a free account or sign in, then open the dashboard. Free includes Brief and Ask, subject to remaining uses and upload allowance. Before starting, make sure you have an upload available and at least 2 uses for one successful Brief and one successful Ask. If you already uploaded this file, reopen it instead (see step 7).
Download the CSV above. On /app, click Select spreadsheet in the upload area and choose main-story-example.csv from your device. If starting from Files, click Upload a file to open the same picker. This single-sheet CSV uploads after it is read; no extra analysis request is needed.
Uploading starts an overall Brief automatically; it uses 1 use only if the Brief succeeds. You should arrive in the file’s conversation workspace. Confirm the filename and 30 rows, 3 columns in its header before interpreting the result.
2. Open the completed Brief
Wait for the Brief to finish. If its panel is closed, click the Brief card marked Open Brief in the conversation. This opens the saved result, not a new run. On a phone, the panel appears below the conversation; tapping the card jumps to it.
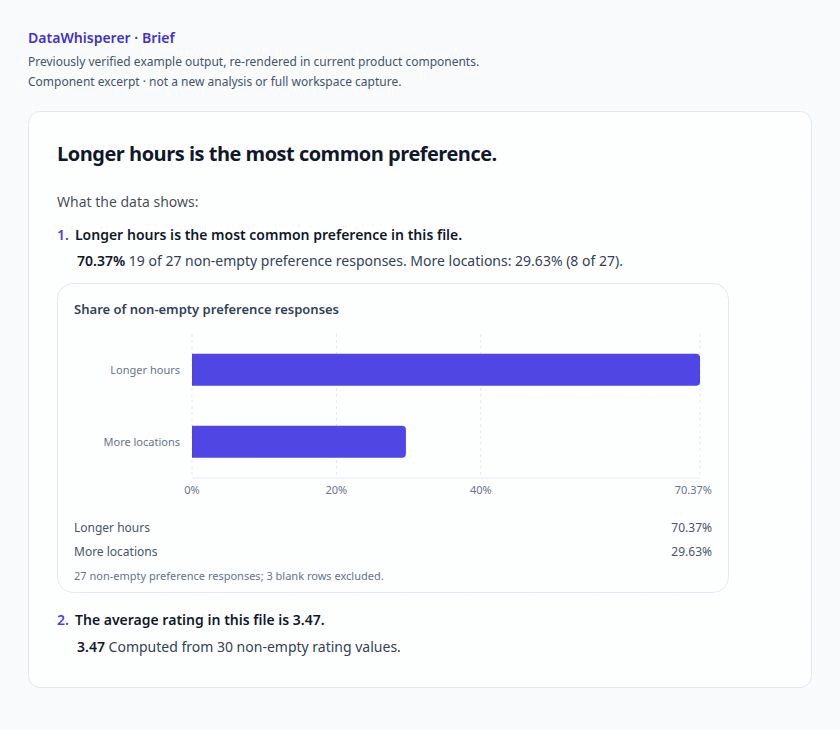
The saved product capture below says “Longer hours is the most common preference.” Read your headline, then its supporting numbers and preference chart; expand Supporting figures if that section is collapsed. The images replay previously verified output in current product components, not a new analysis or full workspace capture. Your wording may differ.
 Brief created in ~13 sec
Representative timing refers to a separate 48-row recording, not this illustrative dataset or screenshot. Clock starts before upload; timing varies by file. Loading and display affect total elapsed time; not a browser completion guarantee.
3. Check the counts and denominator
Compare the Brief’s figures with the downloaded CSV. Each row is one response; blank preference means “no recorded choice,” not a third option.
Longer hours is the leading recorded preference: 19 of the 27 people who gave a preference chose it (70.37%); eight chose More locations (29.63%). Three of the 30 rows have a blank preference, so the percentage base is 27, not 30. The counts add up: 19 + 8 + 3 = 30. “19 of 30” instead describes a share of all rows, not of recorded preferences.
Across all 30 nonblank ratings, the average is 3.47 (104 ÷ 30, rounded). This adds context, not a reason for anyone’s choice. A useful headline: “Longer hours leads the recorded preferences.”
You should now have a checked headline and response base:
- Categories: Longer hours and More locations are the two recorded choices. Blank is missing, not another choice.
- Base: preference percentages use 27 answers; the overall rating mean uses all 30 ratings.
- Arithmetic: 19 + 8 + 3 = 30, and 104 ÷ 30 rounds to 3.47. A chart is not itself verification.
4. Send one focused Ask
Click Back to conversation to leave the Brief panel. At the message box, open the action dropdown (Choose action, beside the send button) and select Ask. Selecting Ask alone does not spend a use.
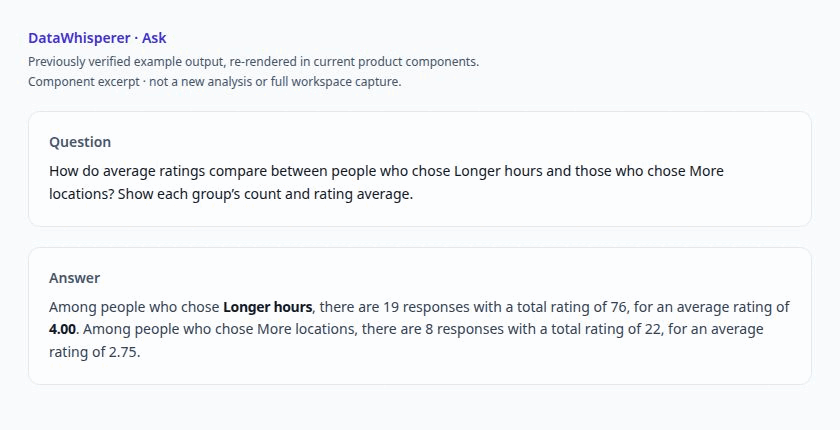
Paste this exact question into the box: “How do average ratings compare between people who chose Longer hours and those who chose More locations? Show each group’s count and rating average.”
Click the arrow button labeled Send (or press Enter). A successful Ask uses 1 use. Wait for the answer to appear in the same conversation; do not send again while it is working.
5. Read and check the Ask answer
The pictured Ask answer reports 19 Longer hours responses, rating total 76 and mean 4.00; eight More locations responses, total 22 and mean 2.75. In your answer, find both counts and means, then check the CSV: 76 ÷ 19 = 4.00 and 22 ÷ 8 = 2.75. Those eight rows have three 4s and five 2s.
 Question answered in ~1 sec
Representative 48-row sample estimate, not a timed action in this preview. File size and task vary; loading and display affect total elapsed time; not a browser completion guarantee.
The three blank-preference rows have ratings but belong to neither choice group. The comparison bases are 19 and 8, not 27 or 30. If your result disagrees, check the source rows and exclusions before sharing. This difference does not show that a preference caused a rating; the file supplies no rating-scale definition, so do not label 4.00 “satisfied.”
6. Write your two-sentence takeaway
Write the checked conclusion in your meeting note or email, rather than sending another analysis request. For this example:
“Among respondents who recorded a preference, Longer hours led with 19 of 27 choices (70.37%), versus eight for More locations; three of 30 responses did not record a preference. Ratings averaged 4.00 for the Longer hours group and 2.75 for the More locations group, a descriptive difference worth investigating—not evidence of cause.”
Describe respondents in this file, not all customers. The file does not explain why the ratings differ or establish which investment to make.
7. Share or print the saved Brief, then reopen it
Click Open Brief on the saved Brief card. To share it, click Share link. In Share this brief, review the sharing notice, click Copy link, and paste the link alongside your two-sentence takeaway in your email or meeting note. Anyone with the link can read the Brief without signing in. The original CSV is not made public by this result link, but the dataset name and saved analysis—including any quotes or source references—are shared. Review them for sensitive information first.
For a PDF instead, click Print / PDF in the open Brief and use your browser’s print dialog to save as PDF (the browser’s wording varies). This prints that Brief, not the Ask answer or your written takeaway. Send your takeaway separately with the link or PDF.
To return later, open Files and select this saved file, or use Recent files on the dashboard (the latest file has Continue working). Reopening the file or its saved Brief and Ask answer does not spend another use or require another upload. A new Brief or Ask request does.
Try it with your own data in DataWhisperer—repeat upload → Brief → check counts and base → focused Ask → checked takeaway → share, using a file you have permission to analyze. For file preparation and workspace help, see Help.